Waterfowl
Where ducks and geese have actually been roosting
Waterfowl is what FowlTracker was built for. Two models read bird activity from weather radar and GPS-tracked birds across the whole continental US, then score every spot you save and every piece of public land.
Two models, one map
Radar for the roost, GPS for everywhere else
- Roost model.
- Built on weather radar, which catches birds lifting off their roosts at dawn. It is the read behind the five-night streak on your spots.
- Presence model.
- Built on GPS-tracked birds, and it runs every day of the year, so it fills in the ground and the dates radar cannot see.
- Auto.
- Leave the map on Auto and FowlTracker picks the stronger model for the date and place you are looking at.
Reading the map colors
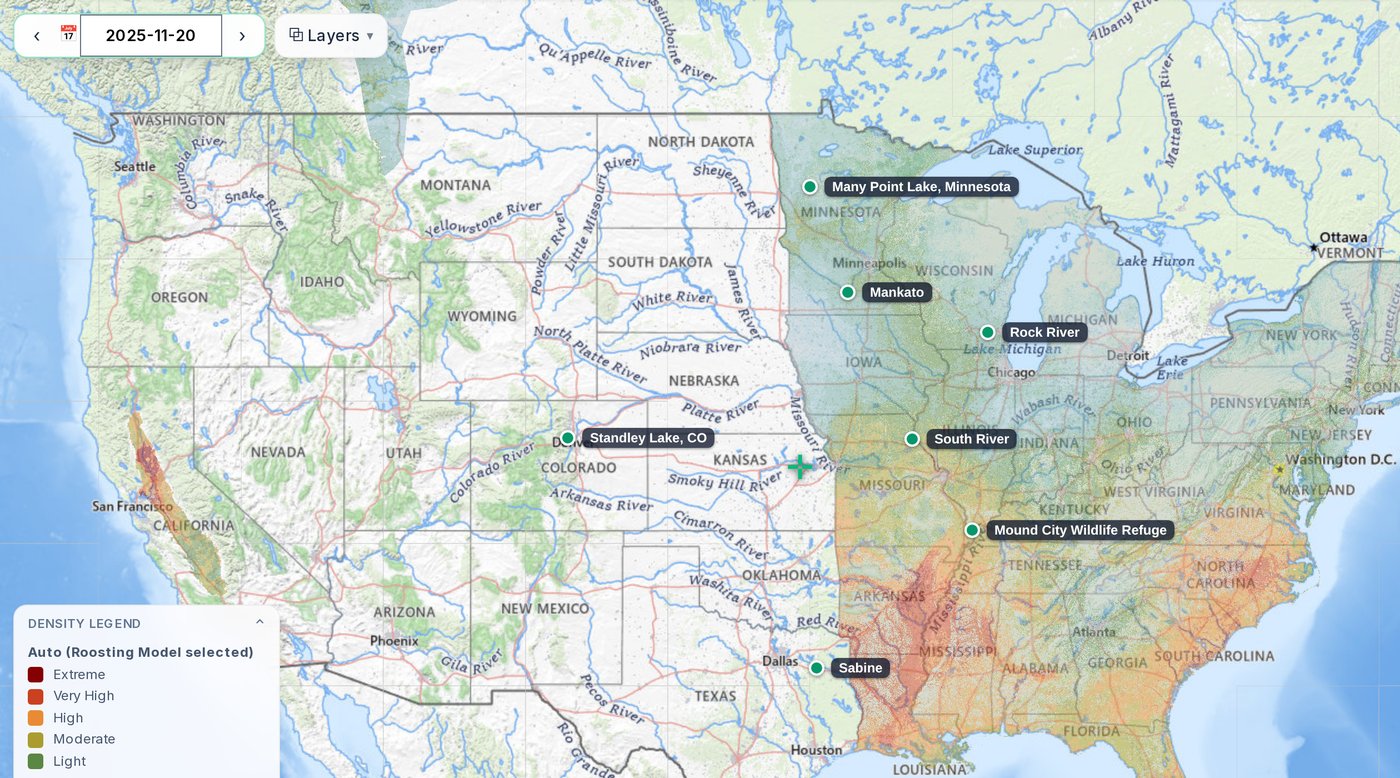
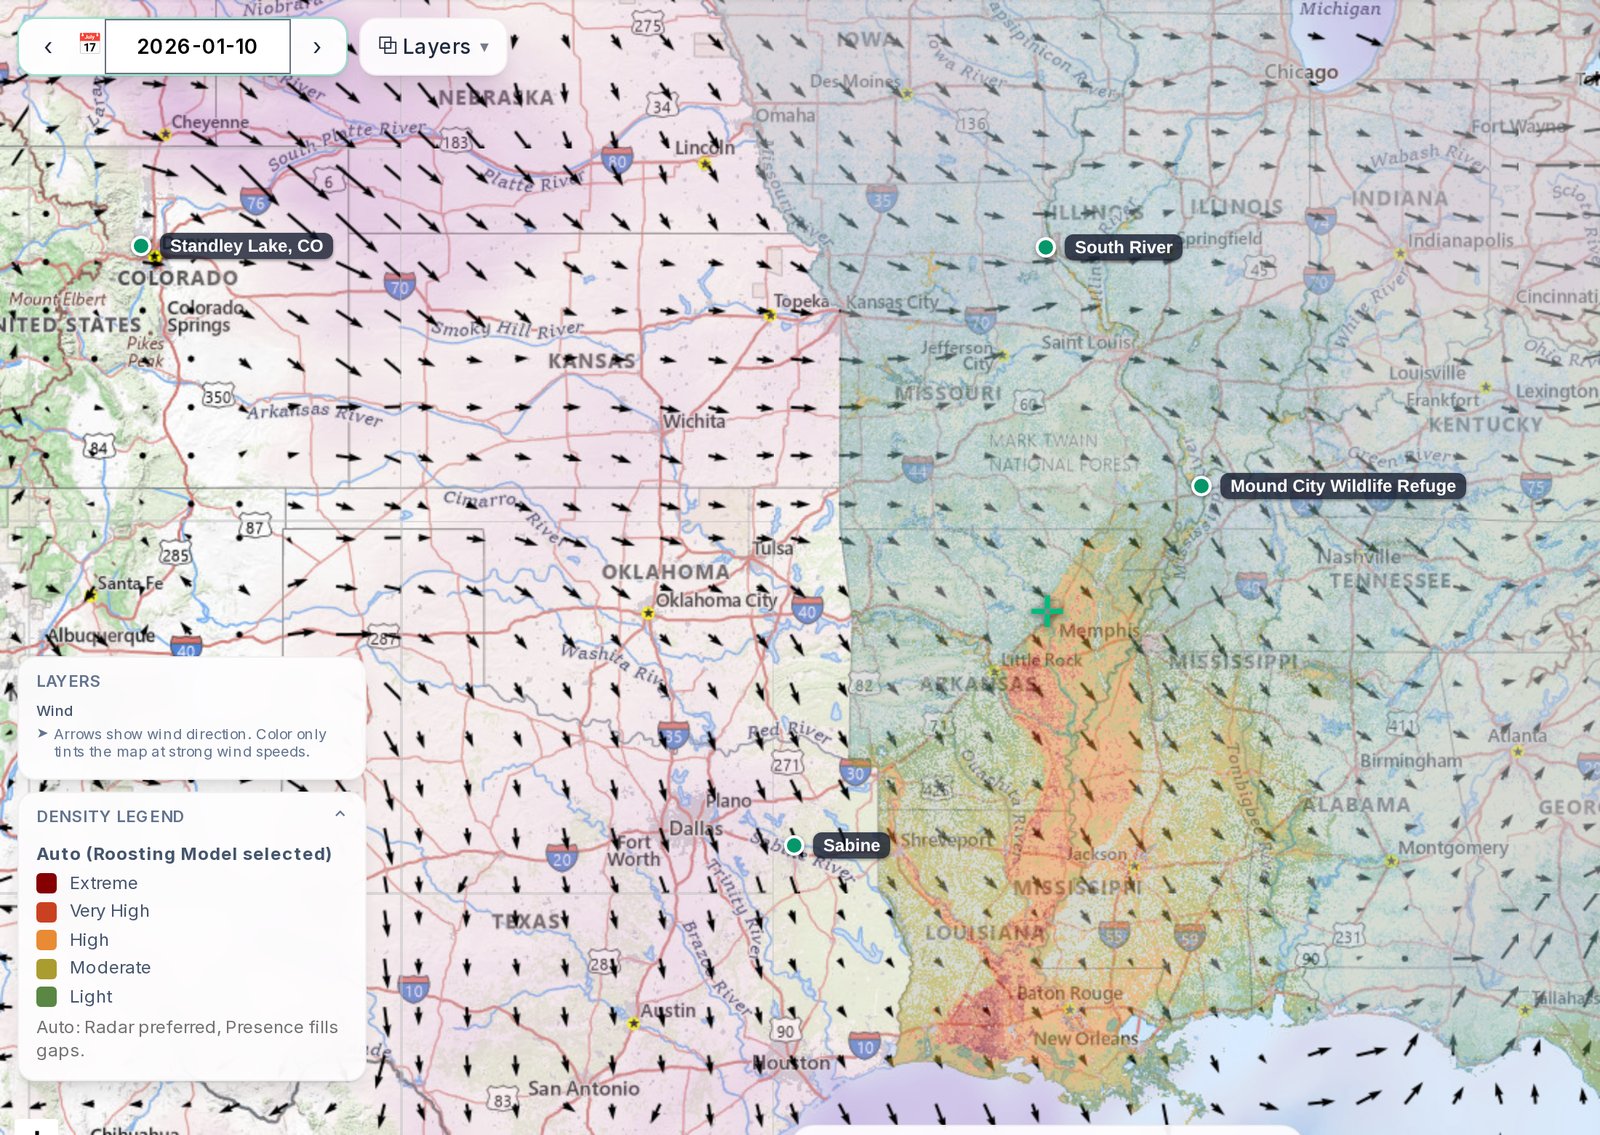
Colors show the strength of the nightly waterfowl signal. The map key in the app names the model it is drawing and lists that model's levels. These are the Roost model's levels.
- Extreme:
- Strongest waterfowl activity signal in this area
- Very High:
- Heavy activity signal (high confidence area to scout)
- High:
- Consistent activity signal
- Moderate:
- Noticeable activity signal
- Light:
- Scattered activity signal
Coverage
Where the data is live
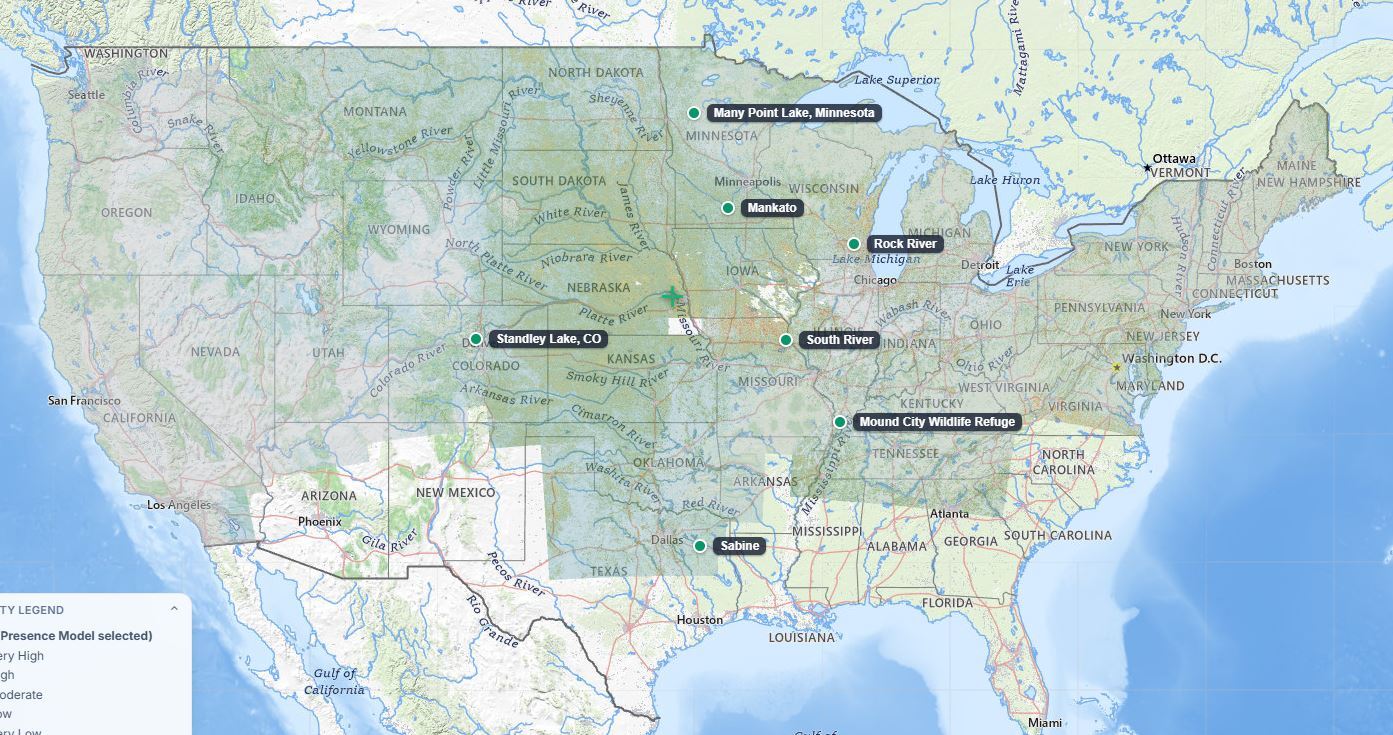
FowlTracker runs two models that cover different ground. Auto picks the better one for the date and place you are looking at, so leave it on Auto and you always get the stronger read.
- Full coverage:
- the entire continental United States.
Feature spotlight
Weigh a spot before you make the call
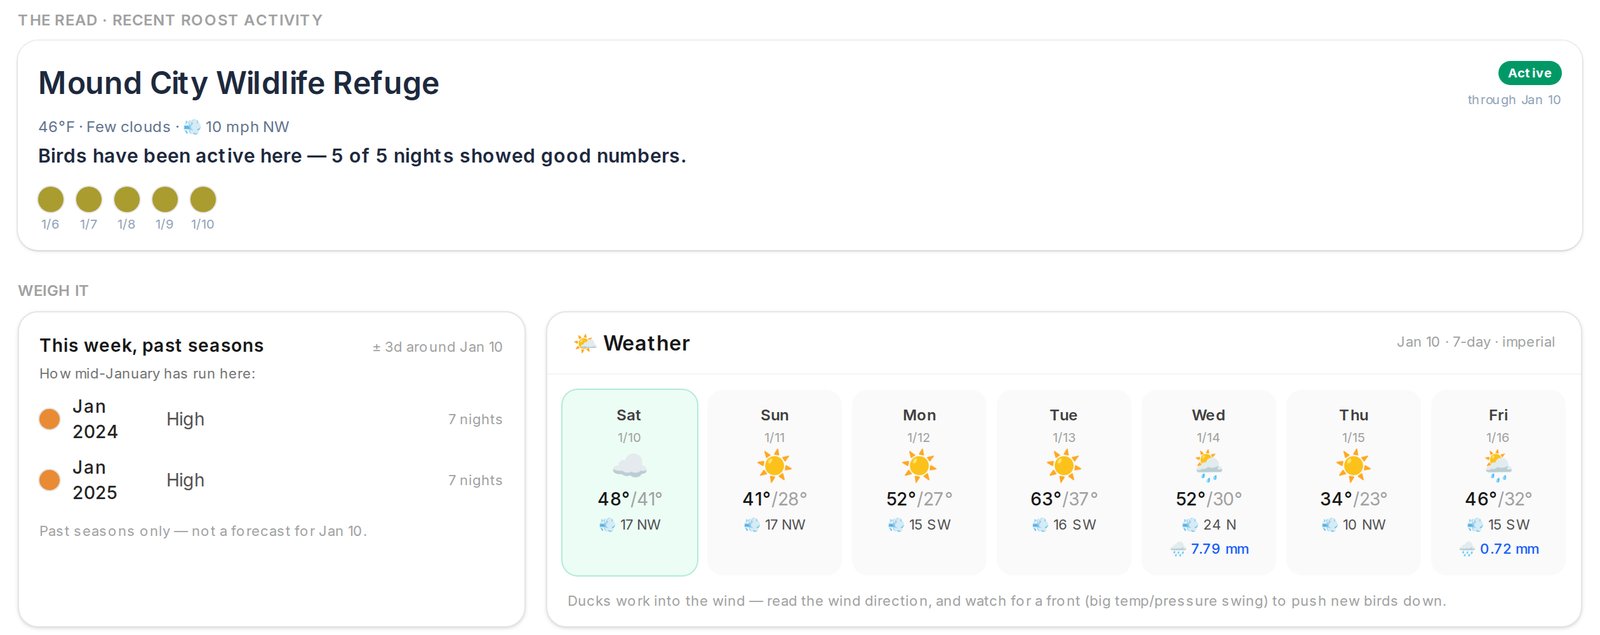
A single night can fool you. Pick the day you are planning to hunt and a spot's page lays out the evidence in the order you would actually weigh it.
- The read: the last five nights of real roost activity at that spot (Premium).
- This same week in past seasons, side by side with a seven-day weather forecast.
- Everything except the forecast is history, not a prediction: what birds did, never a promise of what they will do.
Since 2022
See when a spot runs hot, season by season
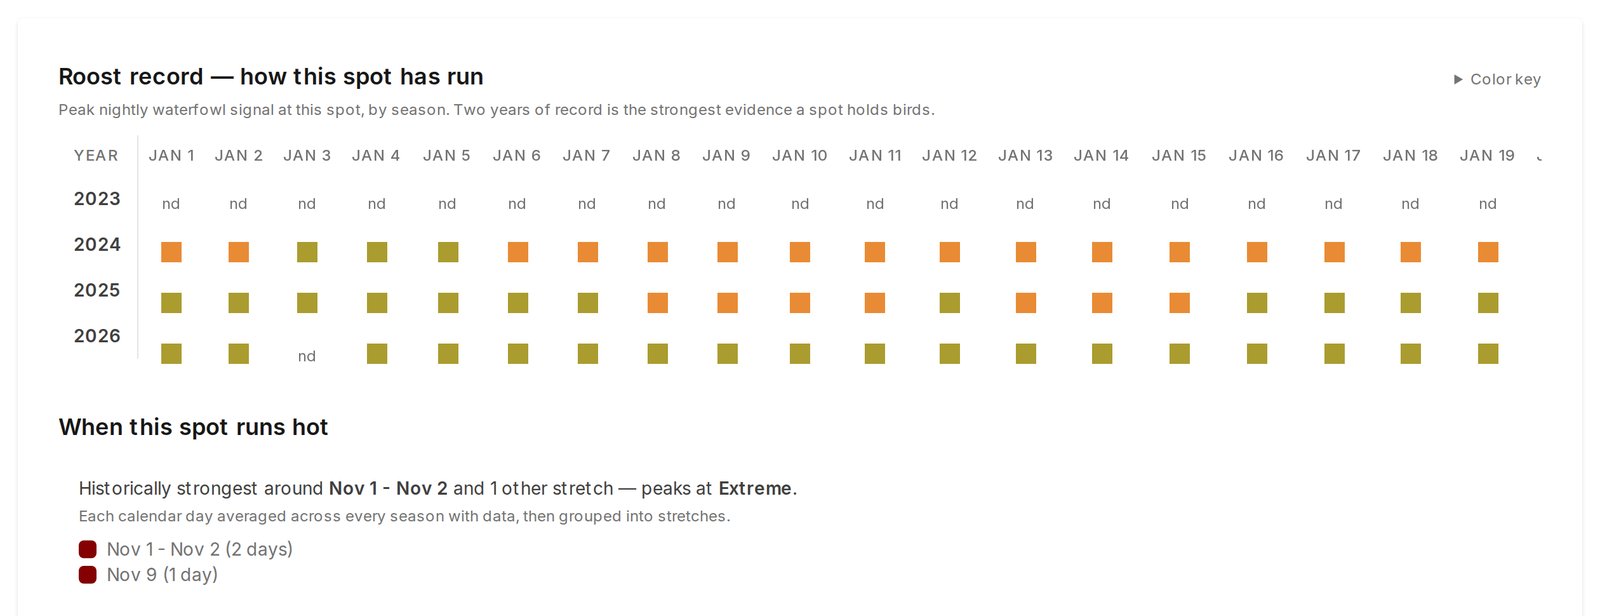
- Roost record.
- With Premium, every saved spot shows its roost record September through April, season by season.
- Strongest stretches.
- See the parts of the year a spot has historically been at its best, so one good night does not fool you.
- Any past date.
- Step the whole map or your Spots board back to any night with data and see how it looked.
Open Water and weather
Know if the field is flooded before you drive out
- Open Water.
- A satellite layer that shows standing water. Zoom in close to see which fields, flats and sheet water are wet.
- Weather overlays.
- Wind, temperature, precipitation, cloud cover, snow depth and humidity, stacked over wetlands and public land.
- Seven-day forecast.
- On every spot page, next to the same week in past seasons. It is the only forward-looking thing in FowlTracker.
Public land
Roost readings for every refuge, WMA and lake
Every wildlife refuge, WMA, national forest and Corps of Engineers unit in a state, with its most recent roost reading. Find the ground worth scouting without driving all of it.
Ranked by roost activity
Sort a state's public land by roost activity, and open any unit on the map to see how much of it sat at each level that night.
Filter by access
Narrow the list to Open or Restricted access, by type, or to units with a reading. Public access is not hunting access, so check the regulations too.
Free to browse
The Public Lands list is on every plan. Premium adds the roost readings on every unit.
Start free and evaluate your own hunting ground.
Start free, save your spots, and see how it lines up with what you are seeing in the field.